
Five method views. Five action plans. Three summaries. In minutes.
Ingenium-MC is not transactional. It is a diagnostic-prescriptive SaaS that analyzes your entire finished goods portfolio across sales, inventory, and contribution simultaneously — then delivers a specific action plan for every product.
Nine fields total, all numbers without commas. No installation, no integration, zero complexity.
Each product is analyzed across five method views using Multi-Factor Diagnostics (MFD) — sales, inventory, and contribution evaluated together, not in isolation.
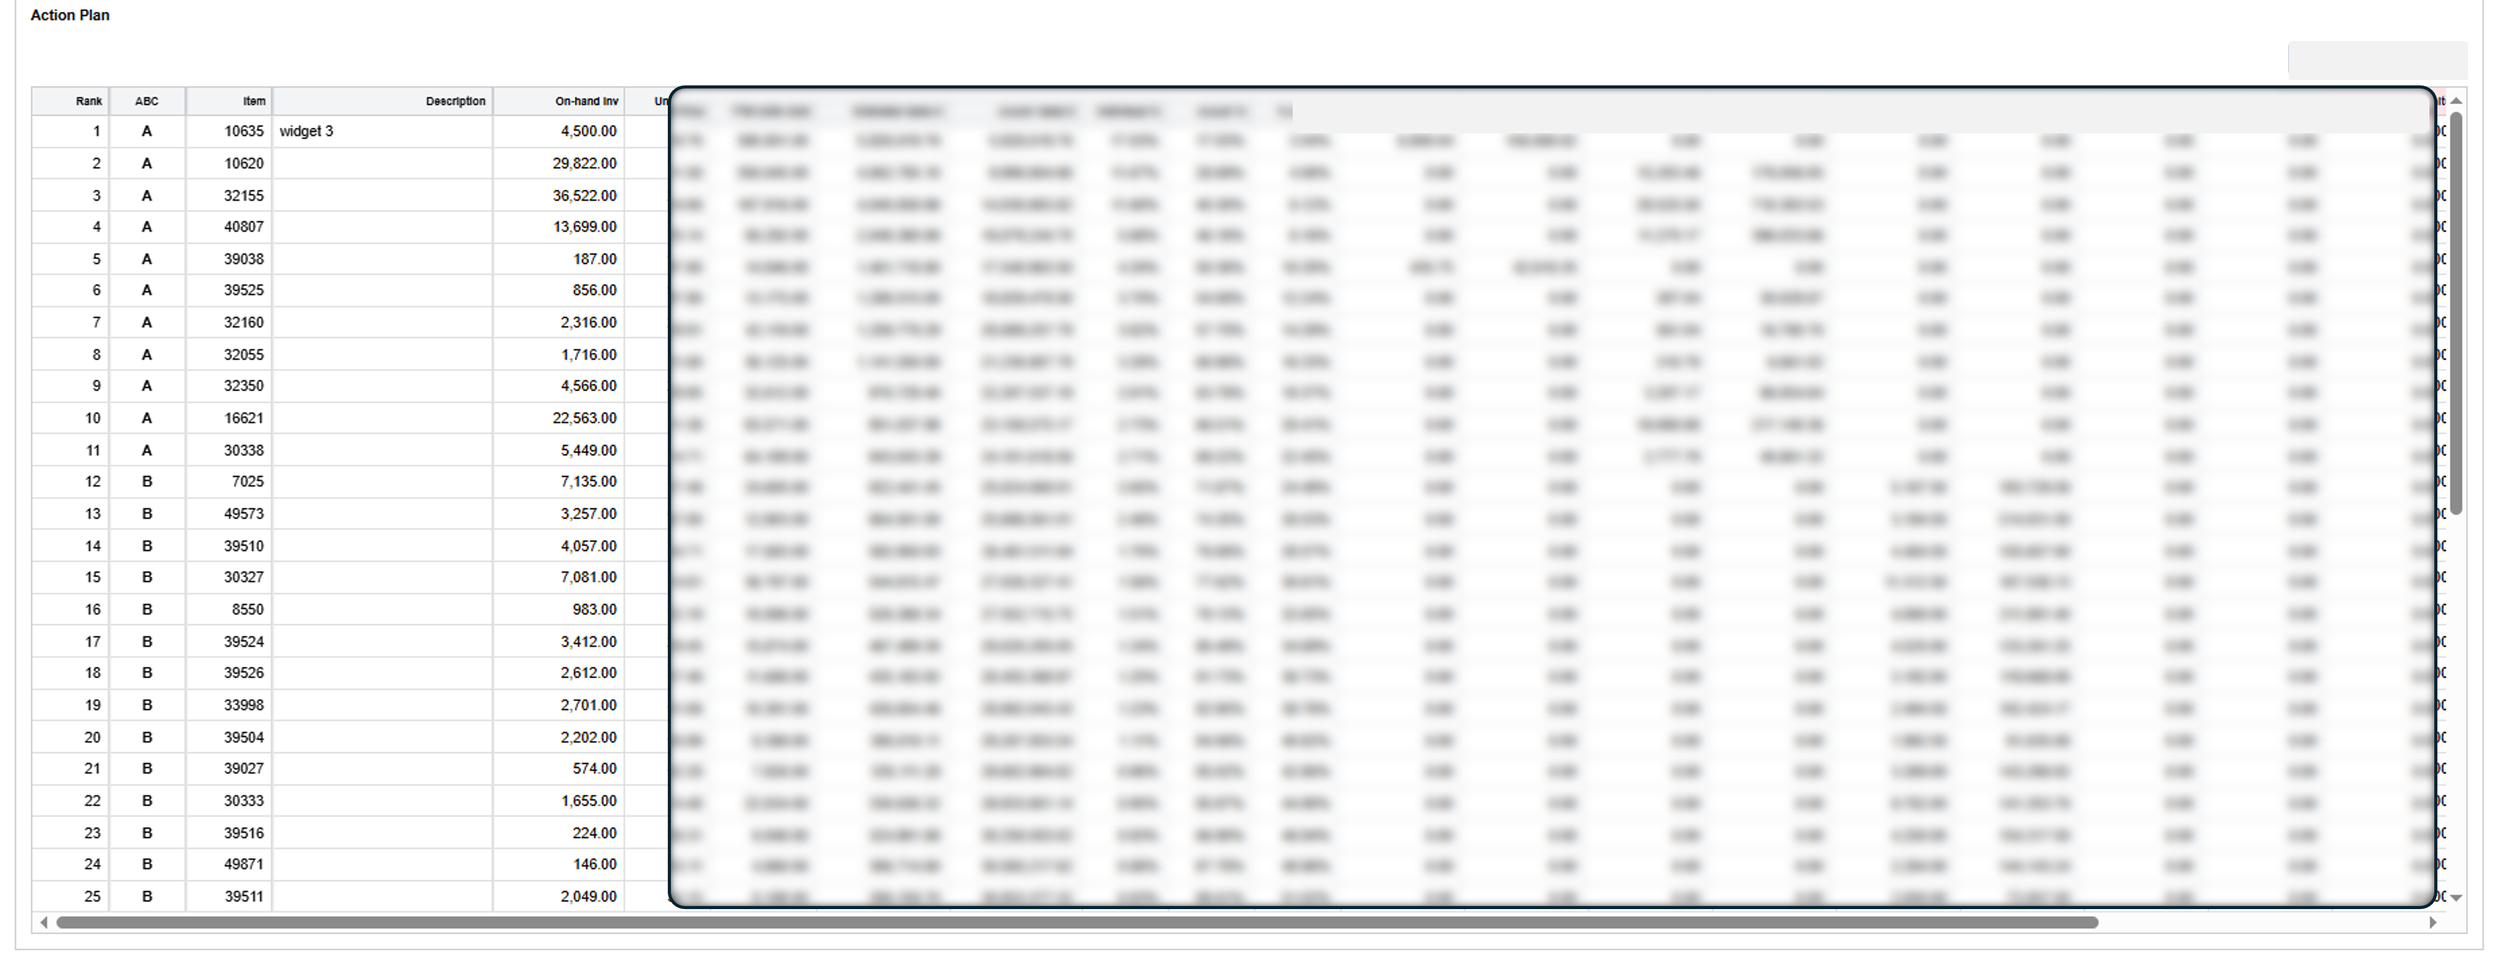
Five action plans and three summaries in CSV and PDF — specific, provable recommendations per product for Sales, Marketing, Finance, and Supply Chain to act on together.
For best results, run monthly for the first quarter to closely monitor progress, then quarterly thereafter — the choice is yours.


Real business impact — not just activity.
Exactly where each product stands — and what to do about it.
Ingenium-MC turns portfolio management from guesswork into a measurable action plan, giving Finance, Marketing, Sales, and Supply Chain a shared, data-backed view to act on together.
Identify which products generate the highest profits and sales — so you can prioritize manufacturing and sales resources where they earn the most.
Surface the products that look healthy on revenue but underperform on margin — the ones quietly eroding your bottom line.
See exactly which products are draining working capital through excess stock — in units and value, per item.
Know where to adjust pricing, reduce cost, relaunch with a new approach, or discontinue — decisions backed by data, not opinion.
Sales loves the volume. Finance worries about the margin. Two views, one portfolio, no shared answer.
When each department looks at performance through its own lens, the decisions that follow are incomplete. Some products sell well and still lose money. Others tie up cash nobody is tracking. And nobody agrees on what to do next.
Products with strong sales figures can still underperform on margin — and single-factor analysis never surfaces them.
Overstock on the wrong products drains working capital while the right ones go short — a pattern invisible without multi-factor analysis.
Without a single integrated view, pricing, relaunch, and discontinuation decisions become opinion-based arguments rather than data-backed actions.
Multi-Factor Diagnostics turns your finished goods portfolio from a guessing game into a measurable action plan.
Ingenium-MC is a diagnostic-prescriptive tool built for Sales, Marketing, Finance, and Supply Chain teams in manufacturing companies.


Two CSV files. Nine fields. That's it.
Upload two CSV files and your complete diagnostic and five action plans are ready in minutes—all numbers without commas.
Private by design. Everything you need, nothing you don't.
Five method views, five action plans, three summaries — a complete portfolio diagnostic in seconds, shared across four departments.
Turn portfolio management from guesswork into a measurable, shared action plan.
Pay-per-use. No subscription. No installation. Five action plans for Sales, Marketing, Finance, and Supply Chain — ready in minutes.